If you ask most college basketball fans they would probably tell you that it is much harder to be a college basketball coach today than it was in the past. The days of Gene Keady and Tom Davis coaching forever seem like a distant memory. Today’s coaches either win now or find another line of work.
Three statements certainly seem true:
1) Coaching turnover is worse than it has ever been.
2) BCS coaches face much worse pressure than non-BCS coaches.
3) You need to win to make the NCAA tournament.
But do the historical data really support those statements? To answer these questions, I built a database of coaches in the 64+ team NCAA tournament era, 1984-2010. Coaching data is readily available from a number of sources including ESPN’s College Basketball Encyclopedia, sports-reference.com, statsheet.com, and Wikipedia. Sadly all are incomplete in some way, and there are various inconsistencies between the various databases. If you want more details on the data, see a very boring section at the end of this post.
Let’s start by looking at whether turnover is worse than it was in the past. Table 1 graphs the percentage of coaching turnover each year. Table 1 also breaks turnover into its two components, BCS jobs and non-BCS jobs.* Of the 347 schools that participated in D1 last season, 51, or 14.7% will have new coaches this fall.**
Table 1

The first trend in Table 1 is that coaching turnover has been roughly stable over time. Perhaps due to the recession it tapered off substantially last summer, but the last five years are very consistent with the historical levels of turnover.
Table 1 also breaks the turnover into the BCS and non-BCS component. Obviously more non-BCS coaches lose their job every year because there are more non-BCS jobs. But do non-BCS coaches have a higher probability of being fired? Table 2 looks to answer this question. Table 2 separately shows the amount of BCS turnover as a percentage of BCS jobs and the amount of non-BCS turnover as a percentage of non-BCS jobs.
Table 2
 A few trends are apparent in Table 2.
-2009 had the lowest non-BCS turnover rate on record. Thanks to the recession, barely 10% of non-BCS coaches were replaced last summer.
-In the late eighties and early nineties, the amount of BCS turnover briefly reached even lower levels.
-Turnover is very similar between BCS and non-BCS positions. If anything, BCS turnover rates are minimally lower.
Sadly I don’t have documentation on all the coaching changes back to 1985. Thus I don’t know how many of these changes were voluntary and how many coaches were forced out for poor performance. But other details in the data can tell us something about why the job change happened.
Of the 1272 coaches to change jobs,
-946 did not start another head coaching job immediately
-326 jumped to a new Division 1 head coaching position
Of those without another job, some like Tom Brennan of Vermont voluntarily retired. But I think we can assume that the vast majority of these 946 changes are situations where the coach was forced to leave.***
Of the 326 coaches to move to a new job
-37 moved from a BCS job to another BCS job
-148 moved from a non-BCS job to another non-BCS job
Besides the BCS conferences, the most common conferences to hire D1 coaches away from other conferences include the MWC, A10, MVC, CUSA, and the CAA. Other elite leagues like the WAC, Horizon, and WCC have not traditionally hired many coaches away from other schools.
-115 moved from a non-BCS job to a BCS job
These are the yearly success stories.
-26 moved from a BCS job to a non-BCS job
These are another type of failure. Certainly some non-BCS jobs are very prestigious today. Think Memphis, Gonzaga, ect. But I’ve looked over the 26 moves from BCS to non-BCS jobs and none of them appear to be a move to a more prestigious position. Some like Greg McDermott moving to Creighton from Iowa St. might have been a mutual agreement, but I would classify all 26 of these moves as a situation where the coach was forced to leave.
Tenure at the Time of Termination
I’d next like to document some facts about the coaches that were forced out. (These are the 26 coaches who moved down to a non-BCS conference and the 946 coaches who lost their job and did not have another D1 coaching job immediately.)
First, I’m going to calculate the tenure of each coach. Sadly, I do not have clean data prior to 1984-85, so I do not know the tenure of all coaches in the early years of my data. But starting in 1994, I can make at least a 10-year tenure calculation.
Of the 650 coaches forced out starting in 1994,
55 had 1 year tenure
45 had 2 years tenure
64 had 3 years tenure
85 had 4 years tenure
81 had 5 years tenure
72 had 6 years tenure
46 had 7 years tenure
33 had 8 years tenure
35 had 9 years tenure
134 had 10 or more years of tenure
A few notes:
-Year 1 is somewhat high because of the large number of interim head coaches in my sample.
-The data also includes many assistants who take over when a long-term coach leaves the school. It appears that these assistants make up a disproportionate fraction of the coaches released in Year 2. Perhaps these coaches get a shorter leash because they were expected to recruit while they were an assistant.
-The peak in terminations appears to be year 4, 5, and 6. But this is a bit misleading. The denominator, the number of jobs that still exist in year 7 and 8 is much smaller. Even though the number of terminations is smaller, that’s also because the number of coaches who make it this far is smaller. As an alternative, let’s estimate the probability a coach will survive to various points in time.
I re-define my exercise as follows: Assume you were hired after 1984-85 to a D1 team****. What is the probability you would survive to various points in the tenure clock?
One advantage of asking the question this way is that I do not have to wait to start using data until 1994. Table 3 shows a step-function with the probability you would survive to various points in the tenure clock.
Table 3

Obviously the odds you survive 10 years are fairly low. But what is the probability you get fired at any single point in time? Table 4 graphs the probability you are fired as a smooth curve.
Table 4

Table 4 estimates a smooth curve and that curve suggests that job separations do not begin to decline until after year 7.
Now clearly at this point, a number of factors can influence whether a coach keeps his or her job. Some of them are easily quantifiable, such as wins. Others are harder to quantify, such as expectations. (Expectations may depend on school prestige, recruiting success, and the interest level of the Athletic Director, which is certainly hard to measure.)
But for today I’m going to stick to a simple question. Does making the NCAA tournament improve a coach’s chances of keeping his or her job?
I estimate a model based on the percentage of seasons the coach has made the NCAA tournament at any point in time. I could obviously graph a number of lines, but to keep the graphs easy to read, I’m just going to show the estimates for two situations. In blue, I show the probability the coach is fired if he never makes the NCAA tournament. In red, I show the probability the coach is fired if he makes the NCAA tournament 50% of the time.
I’m going to look at non-BCS coaches and BCS coaches separately. Tables 5 and 6 show the non-BCS coaches. Tables 7 and 8 show the BCS coaches.
Table 5 and 6: Non-BCS Coaches

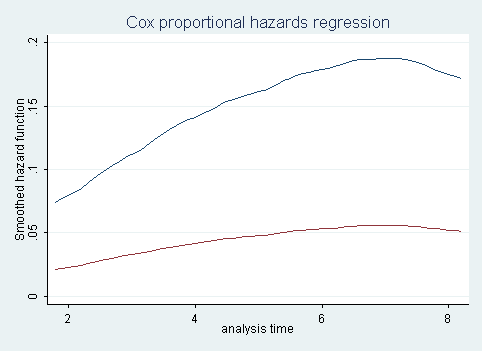
Table 5 and 6 shows that making the NCAA tournament half the time in a non-BCS job ensures almost perfect job security. The red line is close to zero in Table 6.
Table 7 and 8: BCS Coaches


Table 7 shows that if you never make the NCAA tournament in a BCS job, the probability you survive a decade is extremely low. (There are exceptions. See Bill Carmody.)
Table 8 also shows that simply making the NCAA tournament half the time does not provide as much job security in a BCS job. It certainly is a lot better to make the tournament half the time instead of never at all, but many coaches make the tournament half the time and still get fired.
Notice that the odds of getting fired from a BCS job always appear higher. But this is conditional on how often you make the NCAA tournament. And because BCS coaches make the tournament much more frequently, BCS coaches are much closer to their red line and non-BCS coaches are much closer to their blue line. As we saw in Table 2, the overall level of turnover is roughly equivalent.
You may wonder whether survival probabilities would reach 100% if the coach made the tournament every season. The answer is clearly no. Just ask recent Arizona head coaches Kevin O’Neil and Russ Pennel. Or ask Jim Harrick who made the tournament every year at UCLA but was fired for lying to NCAA investigators. Making the tournament matters, but it is not the only thing you have to do to keep your job.
Nonetheless, Tables 5-8 show that the data support the popular perception. Making the NCAA tournament is very important for keeping your job. And this is particularly true if you coach in a BCS conference.
A Few Extremely Boring Notes
* The BCS didn’t exist in 1984-1985, but I count ACC, Big 10, Big East, SEC, Big 12, and Pac-10 members as BCS schools all the way back to 1984-85. Some schools joined a BCS conference in the middle of the database. See Miami FL, Penn St., Rutgers, Virginia Tech, ect. I list these schools in a BCS conference only after they joined a BCS conference. For the Big 12, I had a choice to make about whether to count the Big 8 or SWC as a historical BCS conference. Because many of the SWC schools are not in a BCS conference today, I count only Big 8 schools as being in a BCS school historically and not SWC schools.
**In my merged database, if an interim coach served most of the season, I count two coaching changes. For example, when Minnesota coach Dan Monson was replaced by Jim Molanari early in the 2006-2007 season, I credit that season to Molinari and count a second coaching change when Tubby Smith took over in 2007-08. I do this because when trying to understand coaching styles (tempo, bench utilization, ect.), I want each season to count towards the coach who was actually managing the team.
Besides the obvious impact on volume, this can also alter the timing of some job changes. For example, Jerome Allen actually took over at Pennsylvania as an interim head coach during the 2009-2010 season. (And I use the 2009-2010 data to try to understand his style-of-play.) But most sources do not credit him as officially becoming head coach until this summer. Since he took over early last year, I refer to 51 coaching changes this summer instead of the 52 reported elsewhere.
***You might think I could identify the Tom Brennan voluntary seperations by finding coaches with winning records or some other metric. But that is not as clean as it first appears. Due to NCAA violation issues, graduation issues, and unrealistic expectations, even winning coaches can get forced out.
****I also include coaches whose teams moved to D1, but only after they move to D1. For example, Doug Knoll took over at IPFW during the 1999-2000 season and the school began playing D1 hoops in 2001-2002. Thus I do not include him in the database until 2001-2002, but I do count him as a third year head coach in 2001-2002.
"Mutter Ineffectually" is Usually my Policy
(That's a nod to John Gasaway for those of you who don't recognize it.) I maintain this blog in my spare time and I would like to stay a happily married man so I’m trying to avoid joining Twitter and I rarely respond to email promptly.
But one thing that makes me sad is that I do not have enough time to link to other great statistical articles on college basketball. Linking is very important and I sincerely thank everyone who has linked to me over the years. (A single Luke Winn Top 25 can keep me motivated for weeks.) Thus if you have something statistical that you think would interest me, please send me an email to DLHANNER at GMAIL dot COM.
Recently Villanova By the Numbers managed to contact me and remind me that I’m not the only one writing about the coach hiring process. Do you know how often coaching changes happen after the spring signing period? Did you know that sometimes D1 coaches take assistant coaching positions voluntarily? Here’s Part 1, Part 2, and Part 3 of the VTBN series.